
Colour voltage waveform
Since version 294, ‘Hebelwerk’ has been colouring the sections after they have been used. What the image shows, how it should be interpreted, and what it deliberately is not.
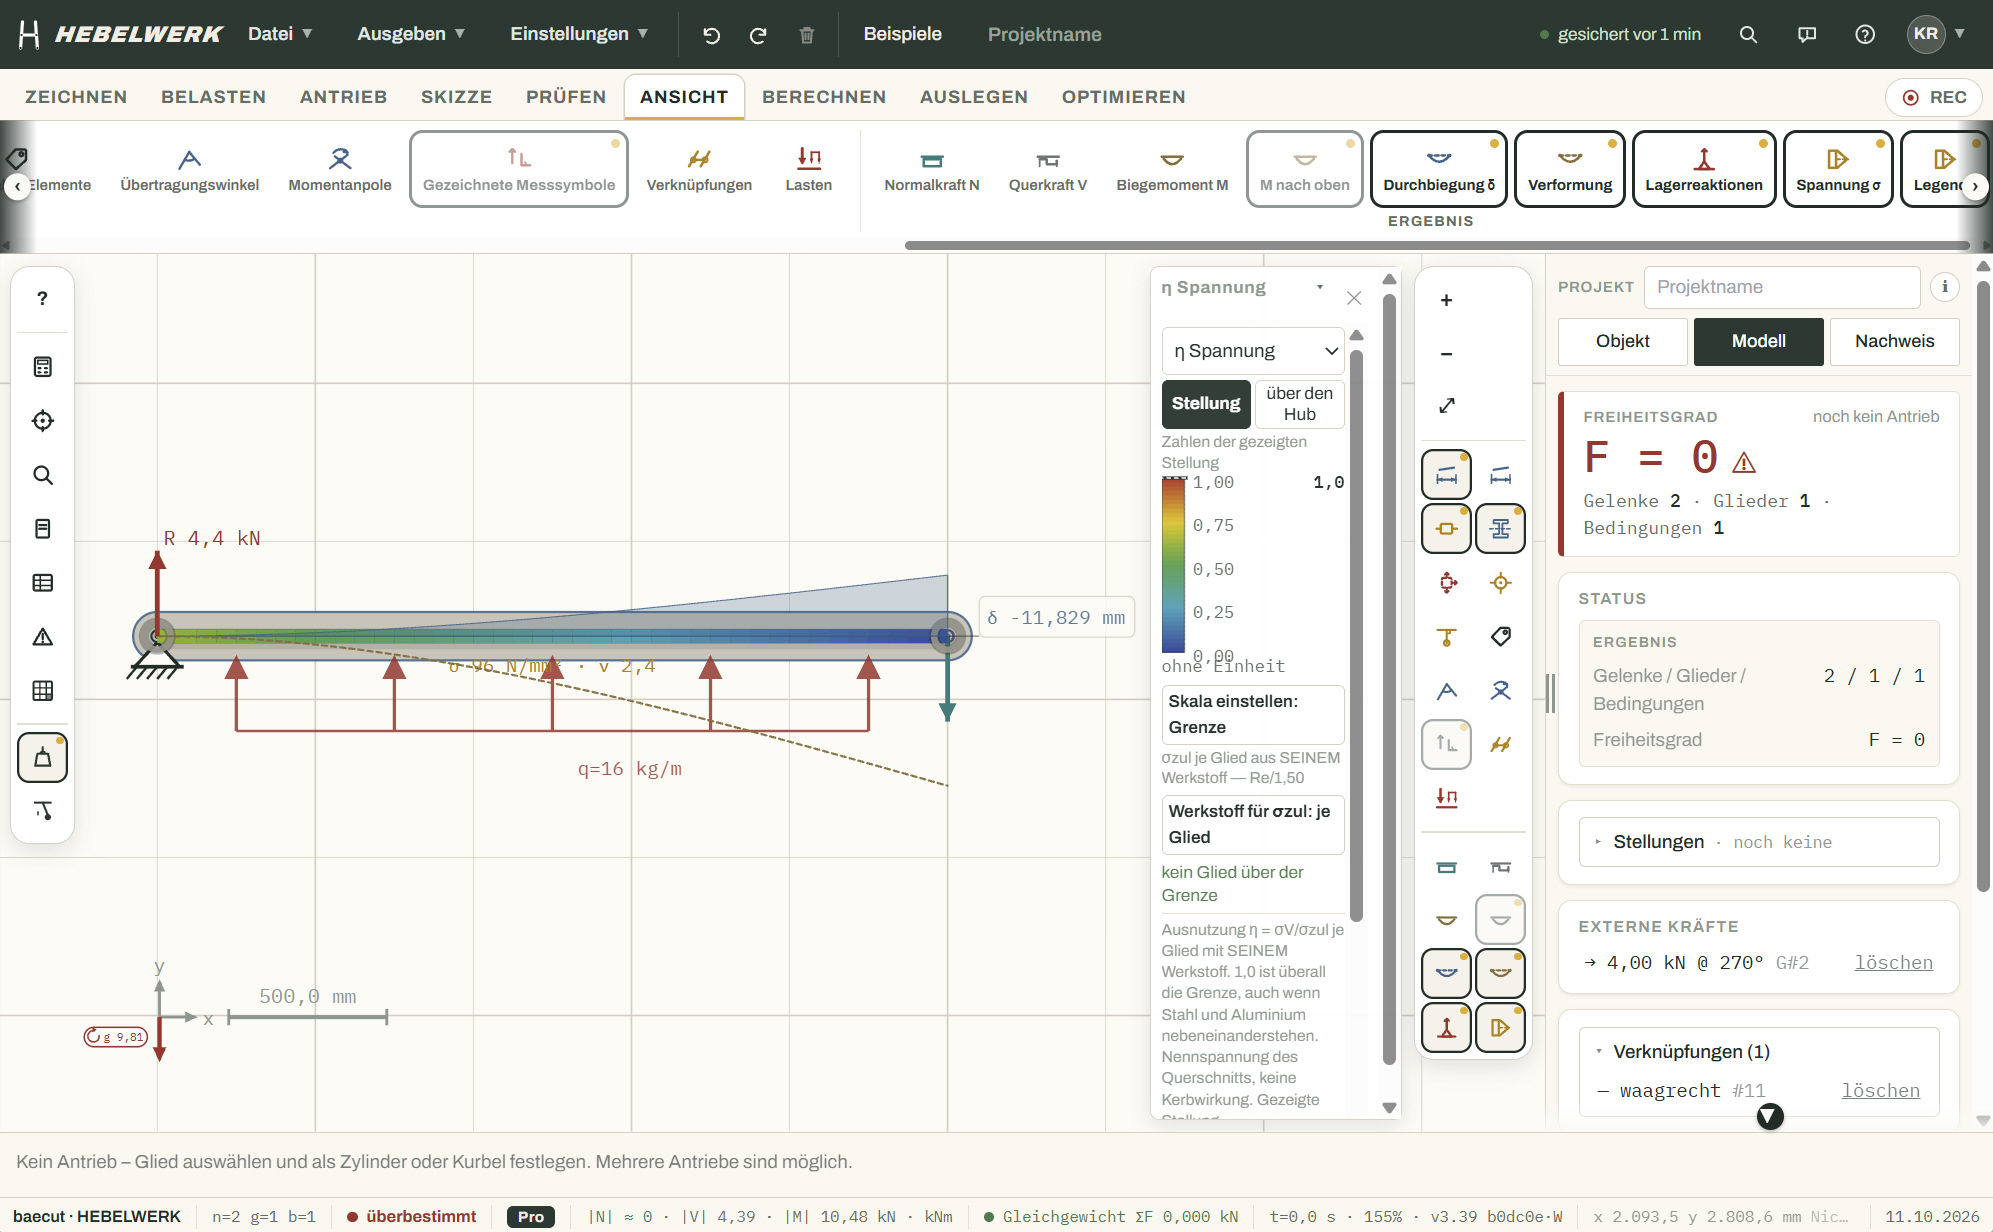
Up to version 293, ‘Hebelwerk’ displayed the tension of a link as a number at the centre of the link. This indicates how high the tension is, but not where. Since version 294, each segment has featured a coloured band showing the voltage along its length, with a legend on the right-hand margin of the page that can be customised. Further parameters have been added in subsequent versions. This article explains what the image shows and how to read it.
What’s new
The colour band does nothing new. It uses the same support points along the member from which the normal force, shear force and bending moment curves are plotted, and colours each section according to the scale selected in the legend. There are now eleven scales to choose from:
- Stress σ resulting from normal force and bending moment, as also stated in the structural analysis
- Marginal tensions at the top and bottom, with signs, in two bands
- Shear stress τ derived from the shear force, by section type
- Von Mises stress, calculated fibre by fibre across the cross-section
- Utilisation η, i.e. voltage divided by the permissible voltage
- Buckling analysis in accordance with Eurocode 3, for each compression member
- Continuous operation as an estimate over a full stroke
- Bending moment, normal force and shear force represented as colours, with the profile’s allowable value as the limit
- Deflection with a limit of L/300 as a guide, adjustable
Added to this is the joint diagram: each joint is assigned a coloured ring based on the most unfavourable of the three types of bolt loading – hole splay, bolt bending or shear. The relevant dimension is shown alongside it.
How to read it
The colour scale ranges from blue through cyan, green and yellow to red, as is familiar from FEM. Anything above the boundary becomes magenta, because red is already taken at the top end of the scale. Grey means: Hebelwerk cannot calculate this value for this element, for example because no profile has been assigned. The corresponding number is shown in the legend.
There are three scales to choose from. ‘Self’ ranges the colours from zero to the maximum value in the model; this shows where the voltage lies, but says nothing about whether it is permissible. ‘Limit’ ranges from zero to the permissible voltage; in this case, red marks the exact limit and any magenta indicates a problem. ‘Manual’ leaves both ends open, allowing you to compare two settings using the same scale.
The permissible stress is the yield strength divided by 1.5, the same safety factor used in the structural analysis. A drop-down menu in the legend allows you to select the material; the origin is specified, for example S355J2 with Re 355 divided by 1.50, equal to 236.7 N/mm². If the colour-coded value differs from the verified value of a component because a different material has been selected in the legend than that used in the component, the legend explicitly states this.
A switch allows you to choose between ‘this position’ and ‘over the stroke’. In the ‘this position’ setting, you can see the current status. In the ‘over the stroke’ setting, Hebelwerk calculates the mechanism’s behaviour once and colours the results according to the maximum value for each link, including the position at which it occurs. In the case of a cam disc in the example set, the bending moment was 0.17 kNm in the initial position and 0.40 kNm at 162°. Anyone looking only at the initial position would underestimate the member by a factor of 2.3.
Beneath the legend, for each size, there is a sentence explaining what the image depicts: the nominal stress of the cross-section in the position shown, without notch effect, without load application, and without localised stress concentration. A colourful image might look like an FEM simulation, but this impression would be incorrect. Anyone wishing to verify a weld or a borehole should refer to the verification documentation, not the image.
An example
A single-span IPE 200 beam with a span of 6 m under a line load: Calculated by hand, the moment at the centre of the span is found to be q·L²/8 = 23.49 kNm and the stress 120.89 N/mm². The colour bar indicates precisely this value at the point x = 3.000 m; at the supports, it is zero. With S235 and a safety factor of 1.5, the utilisation factor is 0.77; the strip remains yellow. If you switch to S355, it turns green. That is precisely the point: you can see, without having to do any calculations, where and by how much.
What the picture is not
No evidence. The evidence is included in the report, along with the calculation method, reference to the standard and safety margin. The image shows where to look.
No fatigue strength according to FKM. The fatigue utilisation is an estimate based on the notch factor as input, calculated as an upper limit, and this is also stated as such. For cast materials, it currently uses the factors for structural steel, i.e. it errs on the side of caution; this is noted in the help section and will be rectified in one of the next versions.
No torsion and no spatial effect. ‘Hebelwerk’ is a flat tool, and so is the image.
You can enable this view in the ‘View’ tab under ‘Results’ using the ‘Stress σ’ switch. When it is switched on, the legend appears in the top right-hand corner, and the selector for the quantity is at the very top of the legend. All settings are saved in the browser.